|
From: John Conover <john@email.johncon.com>
Subject: Analyzing the Health of the US Equity Markets
Date: 9 Jun 2003 21:51:34 -0000
Many theorists use the daily deviation of equity market indices as an indicator of market health-with good reason, too. Here's why.
The historical time series of the DJIA was obtained from Yahoo!'s database of equity Historical Prices, (ticker symbol
^DJI,) for the time interval January 2, 1900, through June 6,
2003-and converted to a Unix database format using the
csv2tsinvest
program. The converted filename were
djia1900-2003.
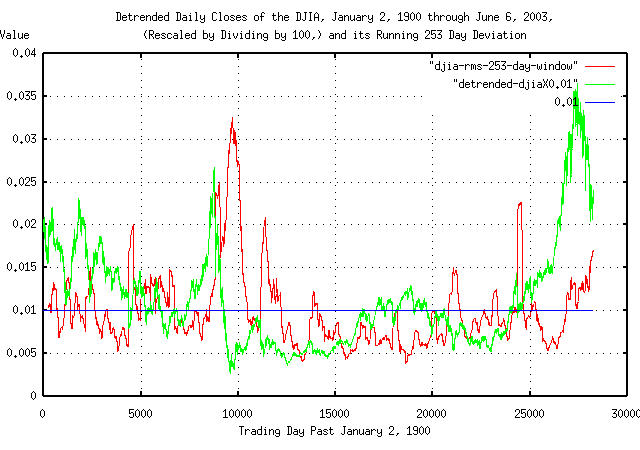
The time series of the DJIA was detrended, and rescaled for plotting:
    tsmath -l -t djia1900-2003 | tslsq -o -t | tsmath -e -t | \
        tsmath -d 100 -t > detrended-djiaX0.01
The time series' running 253 day, (about a calendar year,) deviation of the marginal increments was constructed for plotting:
tsfraction -t djia1900-2003 | tsrmswindow -w 253 -t > djia-rms-253-day-window

|
Figure I is a plot of the relative value of the DJIA overlayed with the running 253 day deviation of its marginal increments. Of interest is that the relative value decreases, (sometimes sharply,) when the running 253 day deviation of the marginal increments increases by 25%-50% over its nominal value of about 1%; note that the running deviation can be used as a forecasting mechanism.
Here is why it works that way. From Section I:
        avg
        --- + 1
        rms
    P = ------- ........................................(1.24)
           2

                 P          (1 - P)
    g = (1 + rms)  (1 - rms)        ....................(1.20)
Note that a very small increase in
rms decreases
P, and g
depends exponentially on P!
--

John Conover, john@email.johncon.com, http://www.johncon.com/