From: John Conover <john@email.johncon.com>
Subject: Re: Fractal "bubbles", Re: Business News from Wired News, and Re: Positive & Negative Bubbles in Asian Markets
Date: 13 Feb 1999 05:14:55 -0000
John Conover writes:
>
> Hi Burkhard. There is a graph that tends to support your conclusions at:
>
>     http://www.johncon.com/john/correspondence/981230002304.31518.html
>
> It would appear that the duration of "bubbles" in the US equity
> markets do follow a 1 / sqrt (t) scenario. The magnitude of the
> "bubbles" seem to be proportional to the sqrt (t). I have a graph of
> that, if you would like me to put it on the site.
>

The above URL/page is a graph of the run lengths of US equity market
expansions and contractions, (ie., "bubbles",) for the last 27
years-the data includes the the DJIA, NYSE, and the S&P 500, by the
day, a simulated fractal, (made with the tsfBm program, using a 60%
persistence,) and, by comparison, the run lengths for a theoretical
random walk fractal.

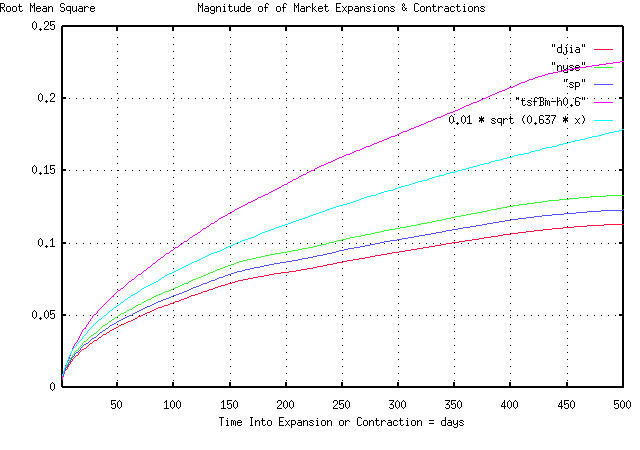
Attached is a graph of the magnitude of the run lengths, using the
same data, and the magnitude for a theoretical random walk fractal.

The graph covers "bubbles" of less than 500 trading days duration,
(about 2 calendar years.)  The way you use it, for example, is to find
the magnitude of a "bubble" at 100 days into the "bubble" (on the
x-axis,) which would have a standard deviation of about 0.1, on the
y-axis.

What this means is that there is an 84.135%, (ie., one standard
deviation,) chance that the magnitude of a "bubble" will be less than
0.1, or 10%. Likewise, there is a 15.865% chance, that it will be
larger than 10%. For example, if an equity index value was 100 when
the "bubble" started, then there is an 84% chance that the value of
the index, 100 days later, will be less than 110, and a 16% chance
that it will be more.

        John

--

John Conover, john@email.johncon.com, http://www.johncon.com/