From: John Conover <john@email.johncon.com>
Subject: Persistence in the US equity market indices
Date: 28 Aug 1999 07:19:58 -0000
What persistence in the equity markets means is that there is more
than a 50/50 chance that an equity value is doing today what it did in
the past.

Unfortunately, the probability of persistence is usually not linear,
and very difficult to measure. The metric of persistence is kurtosis,
(or, more correctly, leptokurtosis.) What leptokurtosis means is that
the fractal that represents the value of a stock has a bell shaped
frequency distribution of the marginal returns, but it is not a normal
(or Gaussian,) bell curve-it is squished in at the sides, and the
tails are too high. For an example, see:

    http://www.johncon.com/john/correspondence/981230002304.31518.html

The traditional methodology of analyzing leptokurtosis has been Hurst
Exponents-a methodology that has been used for about a half a century,
with reasonable success.

Unfortunately, there are issues with Hurst's methods-it is inaccurate
for very short time intervals, (ie., measuring today to predict what
is going to happen tomorrow,) and it is computationally inefficient
for accuracies necessary in programmed trading. It is also quite
sensitive to large "correctional" transients, and does not predict
well for persistences larger than about 60%. Not that any of these in
any way degrade Hurst's contributions-Hurst's methods stand as a
classic and created a paradigm shift in the quantitative analysis of
financial markets that is still being explored today.

The tsinvest program circumvents many of the problems associated with
Hurst's methods by directly constructing a frequency distribution of
like consecutive movements in equity values. If the fractal being
measured has a Brownian motion characteristic, the cumulative
frequency distribution would be 0.5, 0.25, 0.125, ... However, if
there is, say, a 60% persistence, the distribution would be 0.6, 0.36,
0.216, ...

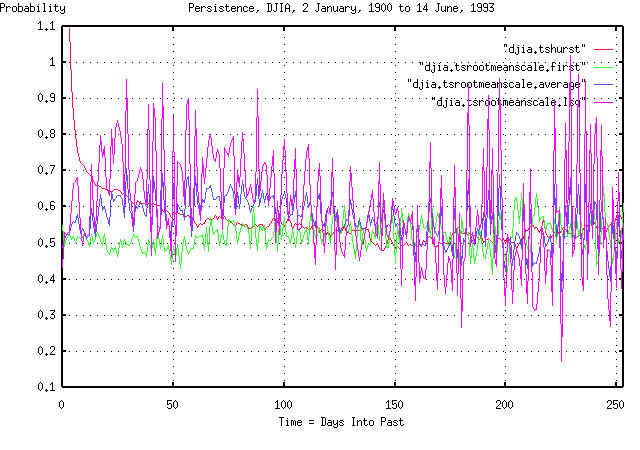
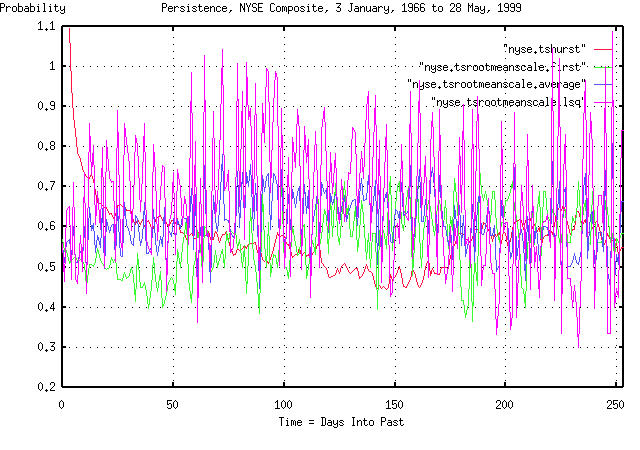
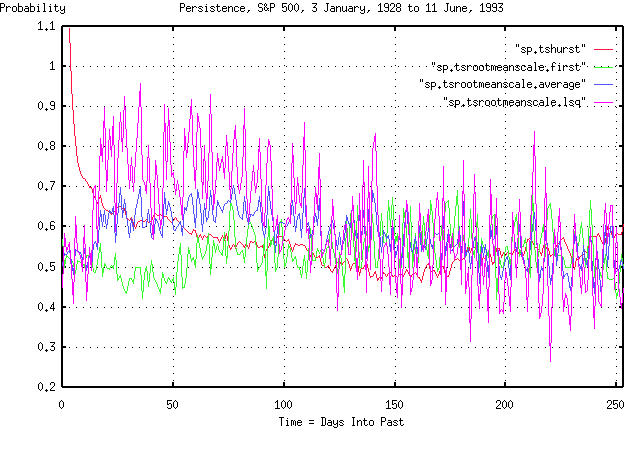
Attached are three graphs that compare the method used in the tsinvest
program and Hurst's method. They are for the daily closes for the DJIA
from 1900 to 1993, the NYSE Composite, from 1966 to the present, and,
the S&P 500, from 1928 to 1993.

Note the discrepancy between the two methods at short time intervals,
less than 50 days, or so. Also, note that the broad market index,
(NYSE,) has no leptokurtosis at about 120 days-but both the DJIA and
the S&P 500 do. (What this means is that the DJIA and the S&P 500,
have about a 60% chance of doing today what they did about 120 days
ago.)  Note, also, that the method used in tsinvest correctly
identifies a very short term persistence, of less than a very few
days, (this continues on into inter-day trading, too; its frequently
exploited by day traders.)

The attached three graphs contain an overlay of three graphs: the
Hurst Coefficient; and from tsinvest, the first element in the
frequency distribution of like consecutive movements; and the least
squares best fit of the frequency distribution.


        John

--

John Conover, john@email.johncon.com, http://www.johncon.com/