From: John Conover <john@email.johncon.com>
Subject: Re: WWII: Causes and Effects.
Date: 5 Sep 1999 20:43:27 -0000
conover@rahul.net writes:
> George Stebbins writes:
> > On Fri, 03 Sep 1999 05:50:15 GMT, conover@rahul.net wrote:
> >
> > > George Stebbins writes:
> >
> > > >
> > > > But there has been one change in the business cycle and that is the
> > > > and that is an increase the longevity of the expansions in the post
> > > > war period. And even Romer's data supports that.  I think this is
> > > > supported by this paper at the KC Fed.
> > > >
> > >
> > > Hi George. Its a bit of a paradox, but:
> > >
> > >    http://www.johncon.com/john/correspondence/990215192020.29398.html
> > >
> > > tends to indicate that the frequency distribution of the run lengths
> > > of the US GDP's contractions and expansions agree very well with the
> > > traditional random walk fractal model, ie., the frequency distribution
> > > is erf (1 / sqrt (t)), irregardless of scale, and the statistics seem
> > > stationary in both the third and fourth quarters of this century.
> > >
> >
> > What paradox?  We are not looking at ether the frequency of the depth
> > of the recession, but their duration
> >
>     .
>     .
>     .
> >
> > > I don't know what to make of it, since the traditional random walk
> > > fractal model is stochastic, ie., dominated by lottery.
> > >
> > > Maybe we can't exercise as much authority over the US GDP as we think
> > > we can.
> > >
> >
> > If the above is true perhaps we do.
> >
>
> Hi George. If the above is true, then the depth should be proportional
> to the sqrt (t), (a fractal kind of thing,) too. If I get time, I will
> put up a graph of it, and we will see.
>
>         John
>
> BTW, a lot of studies of contractions and expansions in the GDP are
> kind of dependent on how contractions or expansions are defined. The
> program that made the graphs looks at the marginal increment, from one
> time unit to the next, and if it went up, it was the start of an
> expansion, and if it went down, it was the start of a contraction. The
> expansion, or contraction, continued until the GDP was equal to the
> value that initiated it. How many time units intervened in between,
> (ie., the contraction's or expansion's run length,) was assembled into
> a frequency histogram, and integrated to get the cumulative
> distribution, which was graphed. Although consistent with formal
> fractal methodologies, it might not be consistent with traditional
> economic definitions of contraction or expansion. FYI.
>

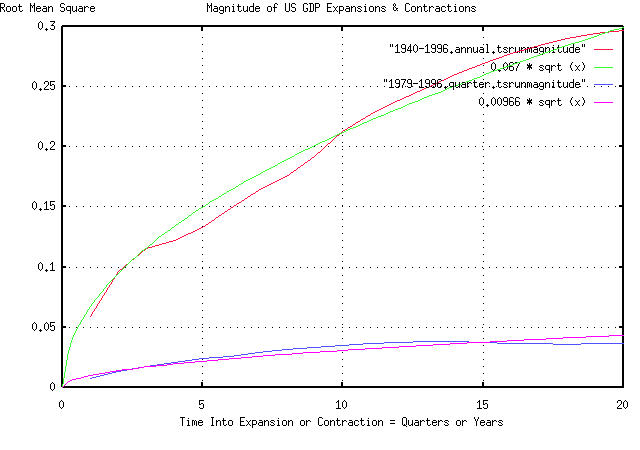
Hi George.

is a graph of the magnitude of the run lengths of the US GDP's
expansions and contractions, by the year, 1940-1996, and by the
quarter, January, 1979-December, 1996, using the same data in the
above graph. The magnitudes of contractions and expansions do seem to
follow a sqrt (t), (or t^n, n < 0 < 1), type of scenario, kind of as
anticipated. Although probably not a simple Brownian motion type of
fractal scenario, (its difficult to tell with a limited data set size
of 60-80 elements,) some kind of fractal characteristics do seem to be
asserting their self.

Using the stochastics of simple Brownian motion fractal as an
approximation to the fluctuations in the US GDP, the chances of
finding a duration of an expansion or contraction of exactly length t
would be 1 / (t ^ 1.5), (for t >> 1,) and the chances of an expansion
or contraction continuing past time t, (ie., continuing,) would be the
cumulative sum, or 1 / sqrt (t). The magnitude of an expansion or
contraction would be proportional to sqrt (t).

Its still enigmatic why fractal stochastics, with their implication of
randomness, model the fluctuations in the US GDP at all.

        John

BTW, the approximation used above assumed that the marginal
increments, ie., the fluctuations, of the US GDP, are statistically
independent. They are not. They seem to have about an 80% persistency,
(85.742% annually, 78.7847% by the quarter.) So the math used in
probability calculations should be of the form t ^ 0.8, instead of the
assumed t ^ 0.5 = sqrt (t). Using the 80% persistency, the graphs at
different scales seem to agree with conventional fractal dynamics,
although it is difficult to tell with such a limited data set size.

--

John Conover, john@email.johncon.com, http://www.johncon.com/